Cumulative Visualizations
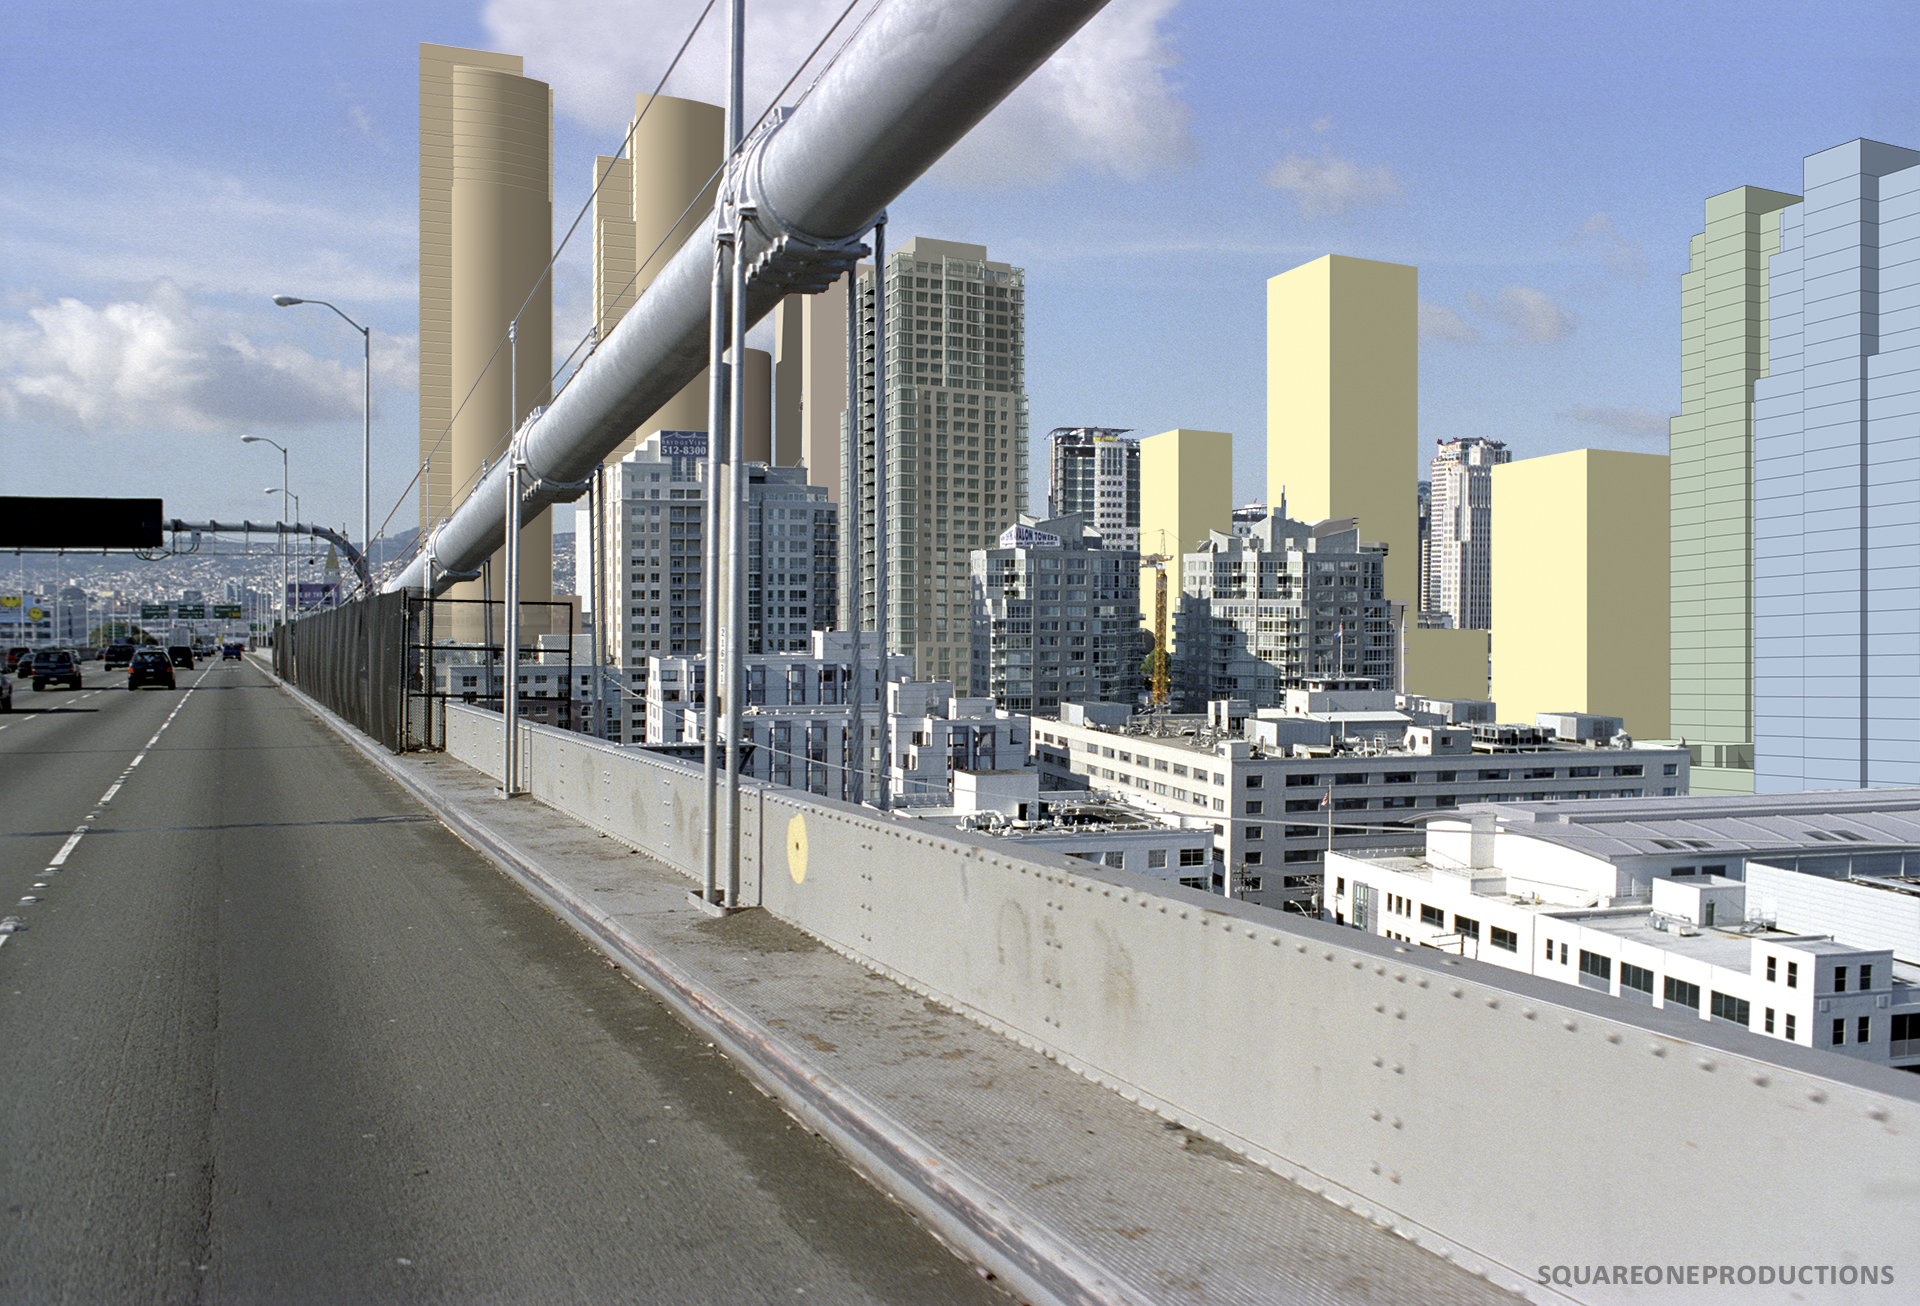
How does one portray a project’s visual impact when that neighborhood is undergoing rapid transformation? When the neighborhood will look different when by the time the project is approved? CEQA sets the baseline at the date of the Notice of Preparation for the project. However sometimes a fuller understanding comes from additional simulation of the area’s near future: approved projects or the maximum zoning envelopes - especially if those zoning envelopes have changed.
Rincon Hill
San Francisco’s Rincon Hill has had a long and varied history, from fashionable neighborhood to warehouse district to skyscrapers. Its current incarnation is the result of the Rincon Hill Area Plan, adopted in 2005. While previous Rincon Hill height limits capped out at 250 feet, the 2005 Rincon Hill Plan accommodated heights of up to 550 feet.
We have been fortunate to work on several projects within in the Rincon Hill Plan. For several of these projects, we produced additional simulations showing already-approved projects and the maximum zoning envelopes allowed under the Rincon Hill Plan.
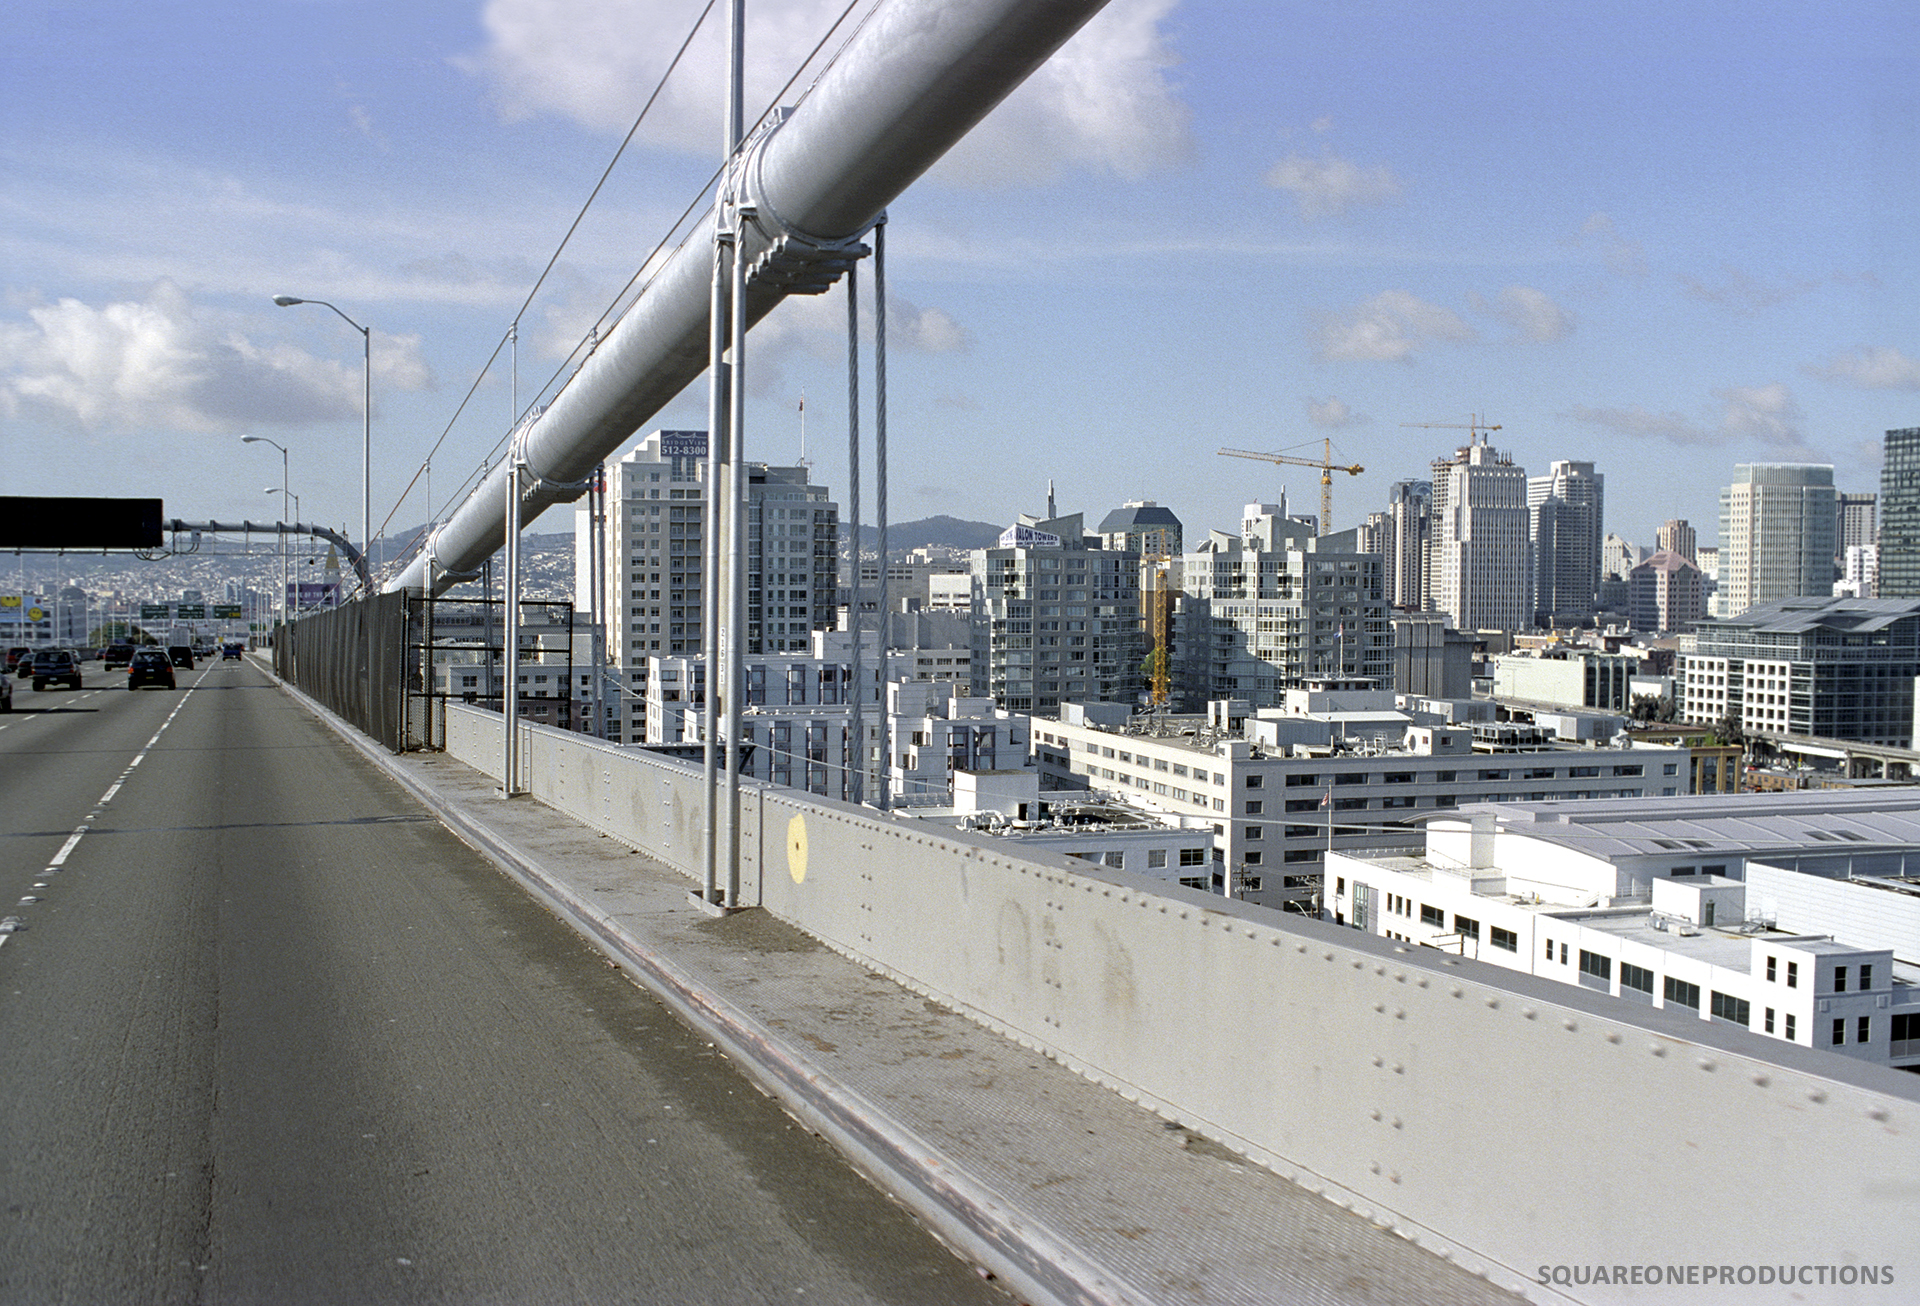
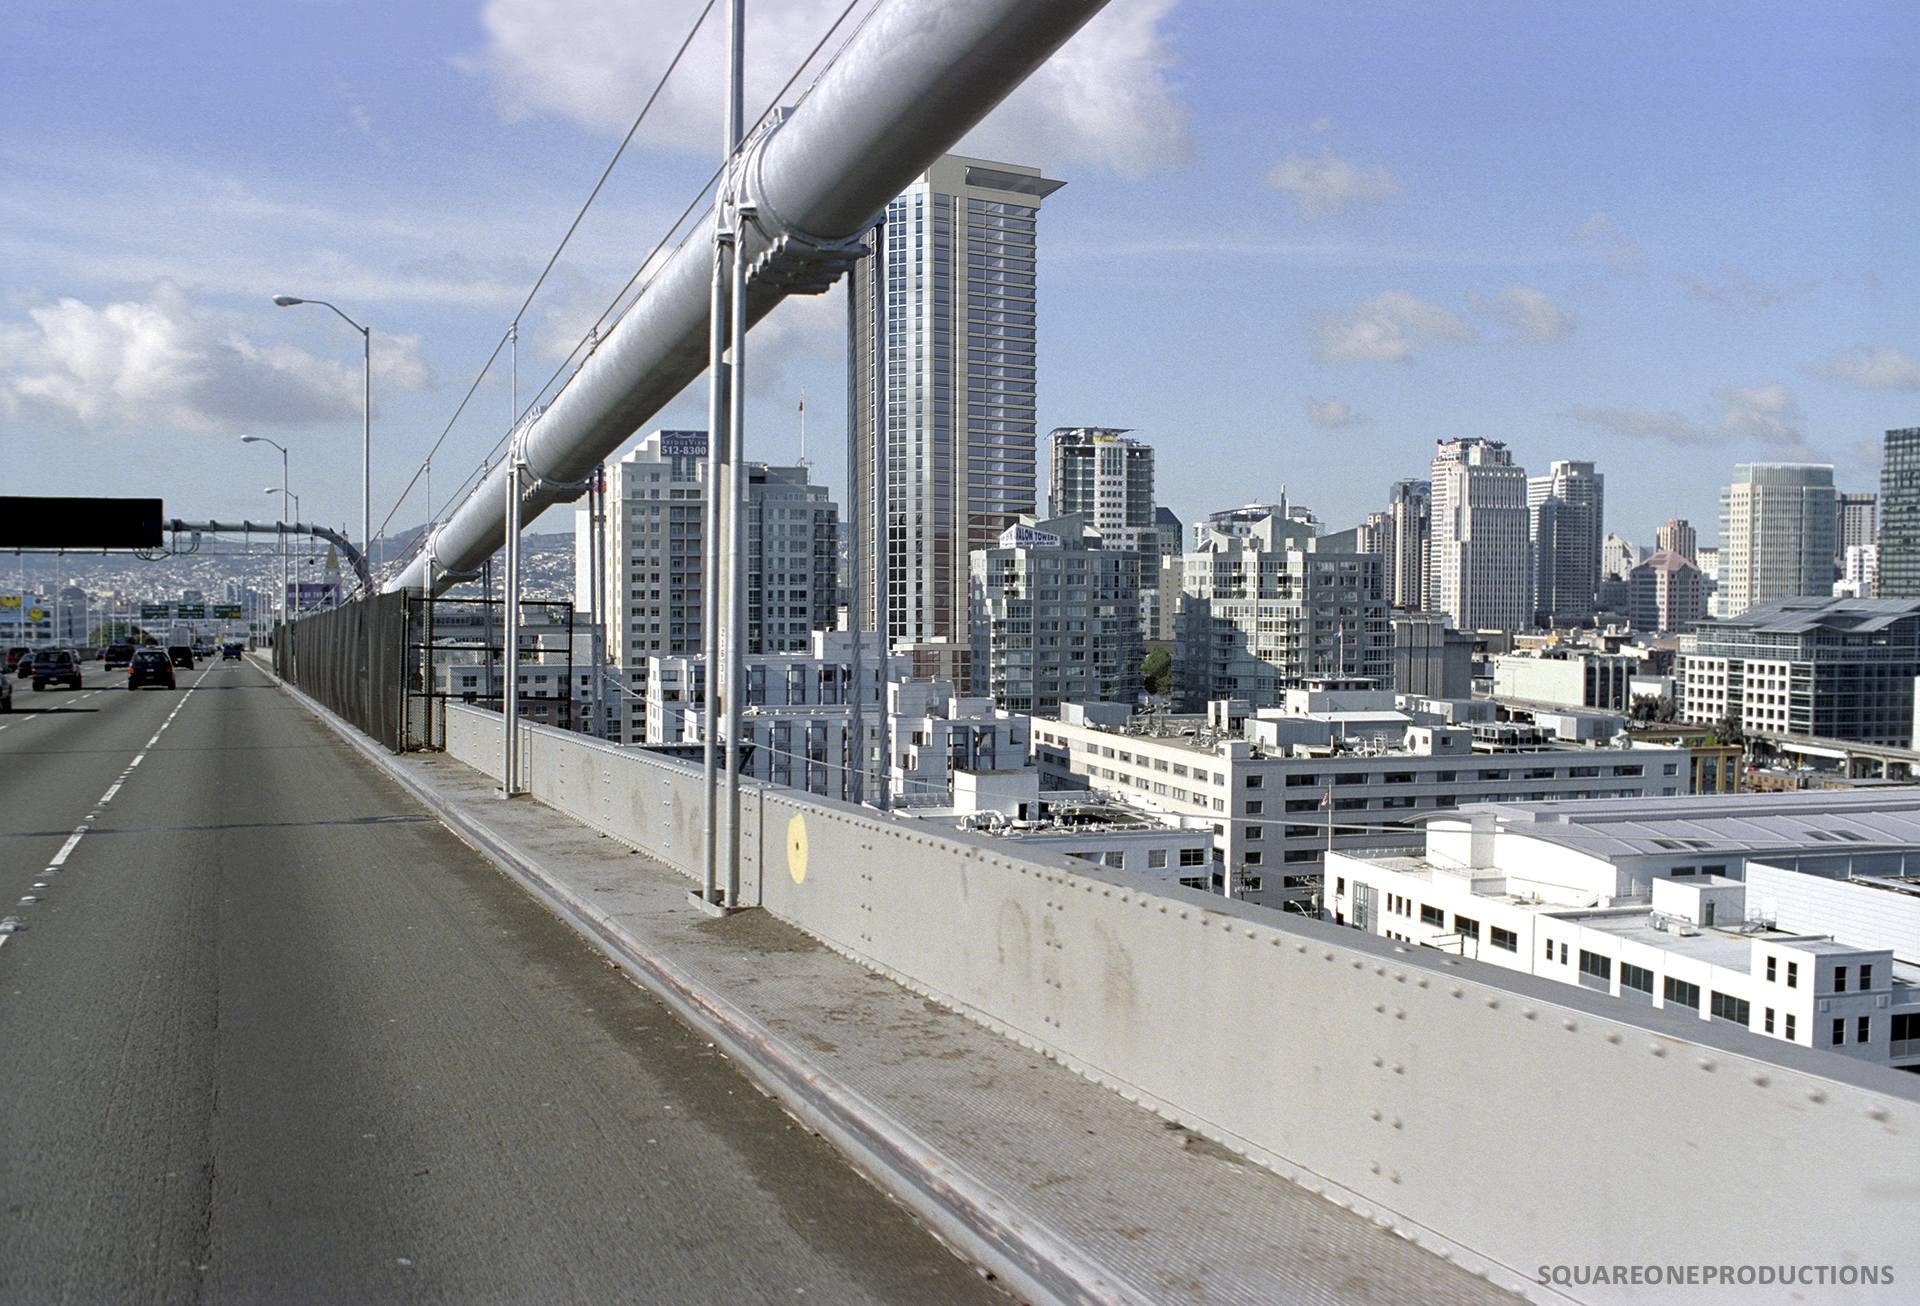
399 Fremont from the Bay Bridge
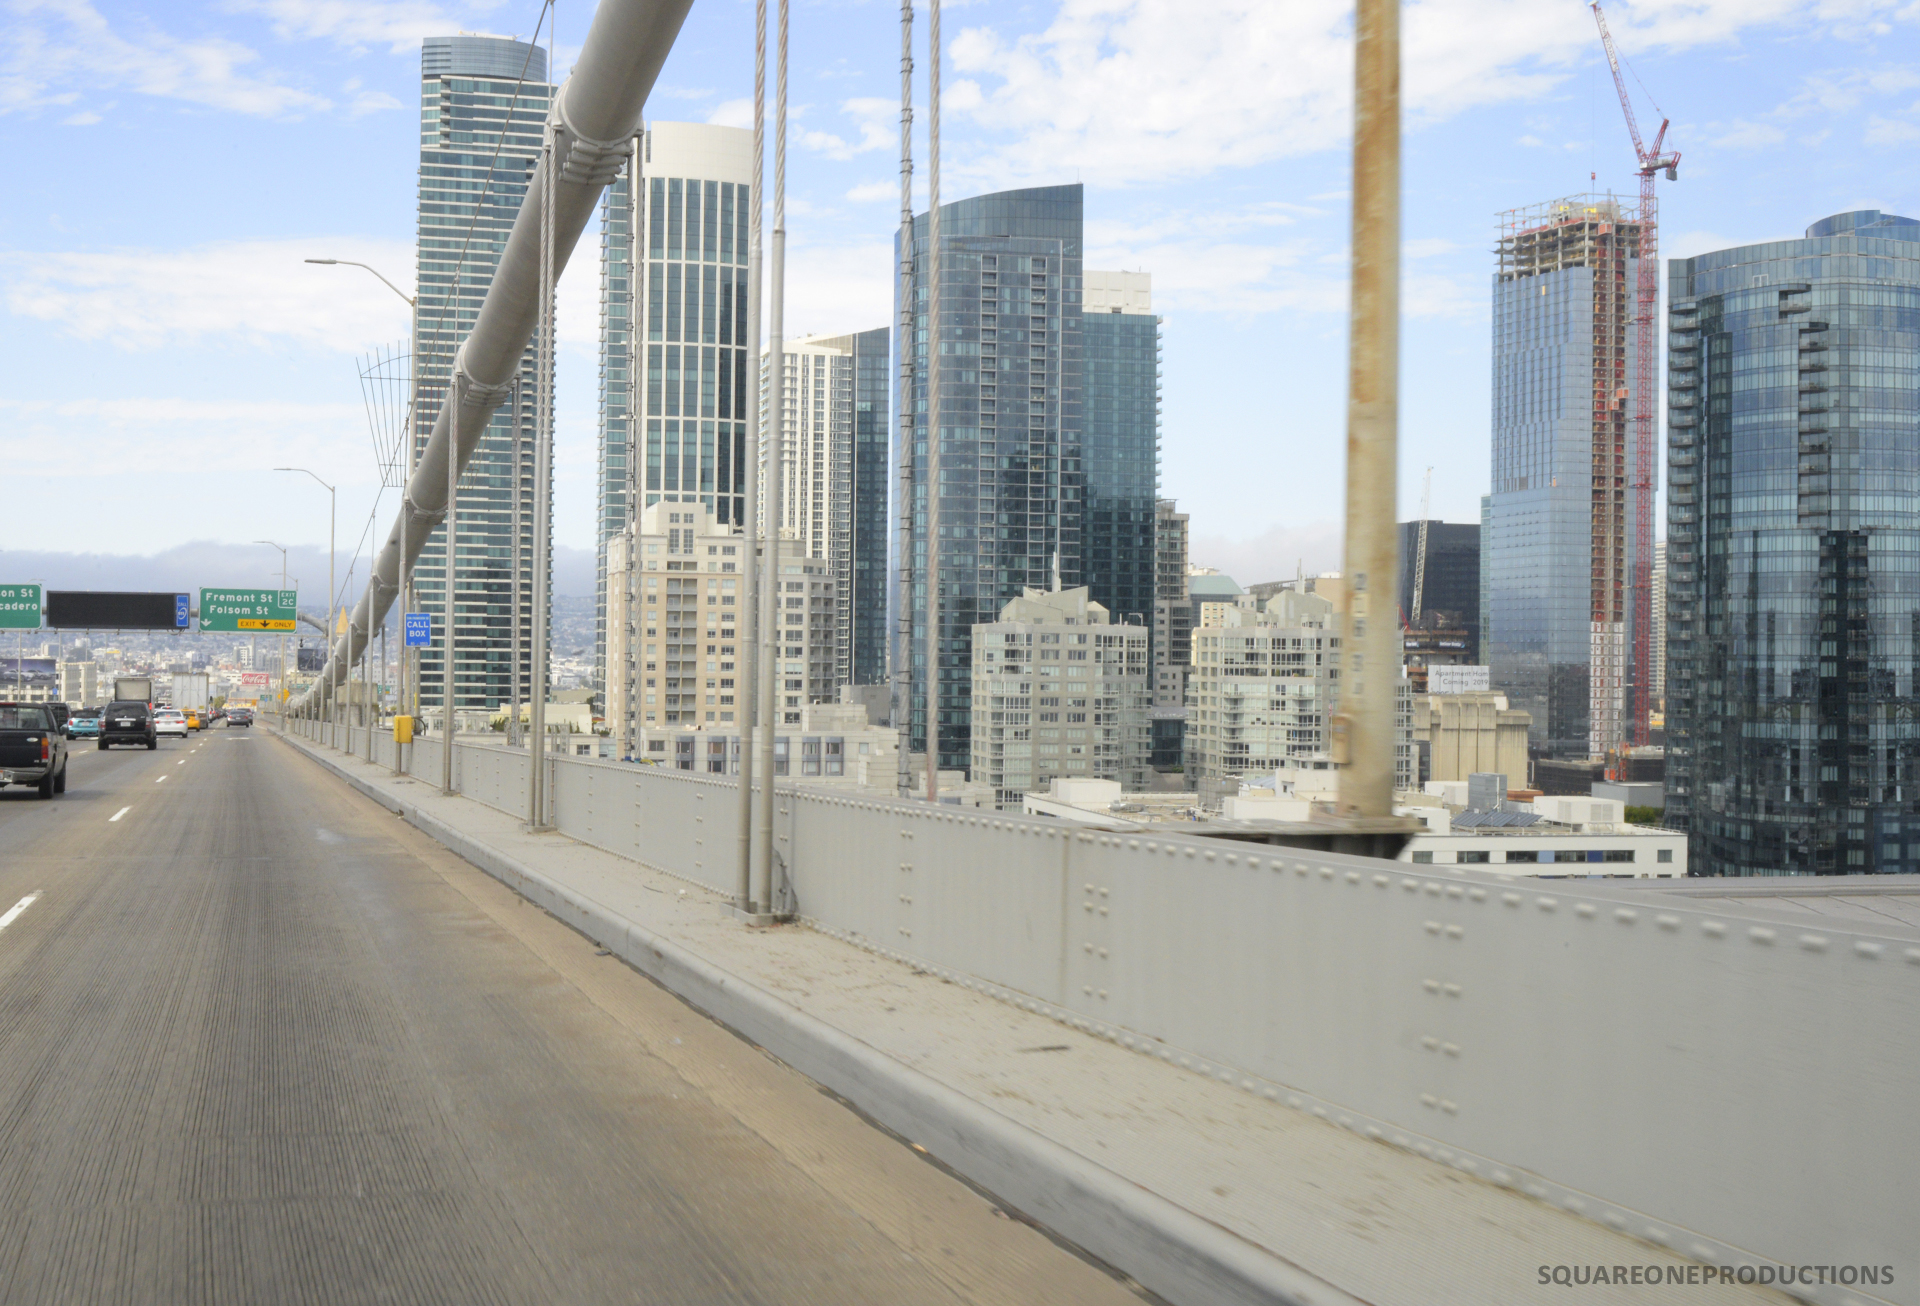
The higher zoning envelopes of the new plan seemed like a dramatic change to us in 2005, when we produced this simulation of 399 Fremont Street. Since then, San Francisco’s population has increased by over 100,000, and we now appreciate the foresight shown in the Rincon Hill Plan.
Fremont Street
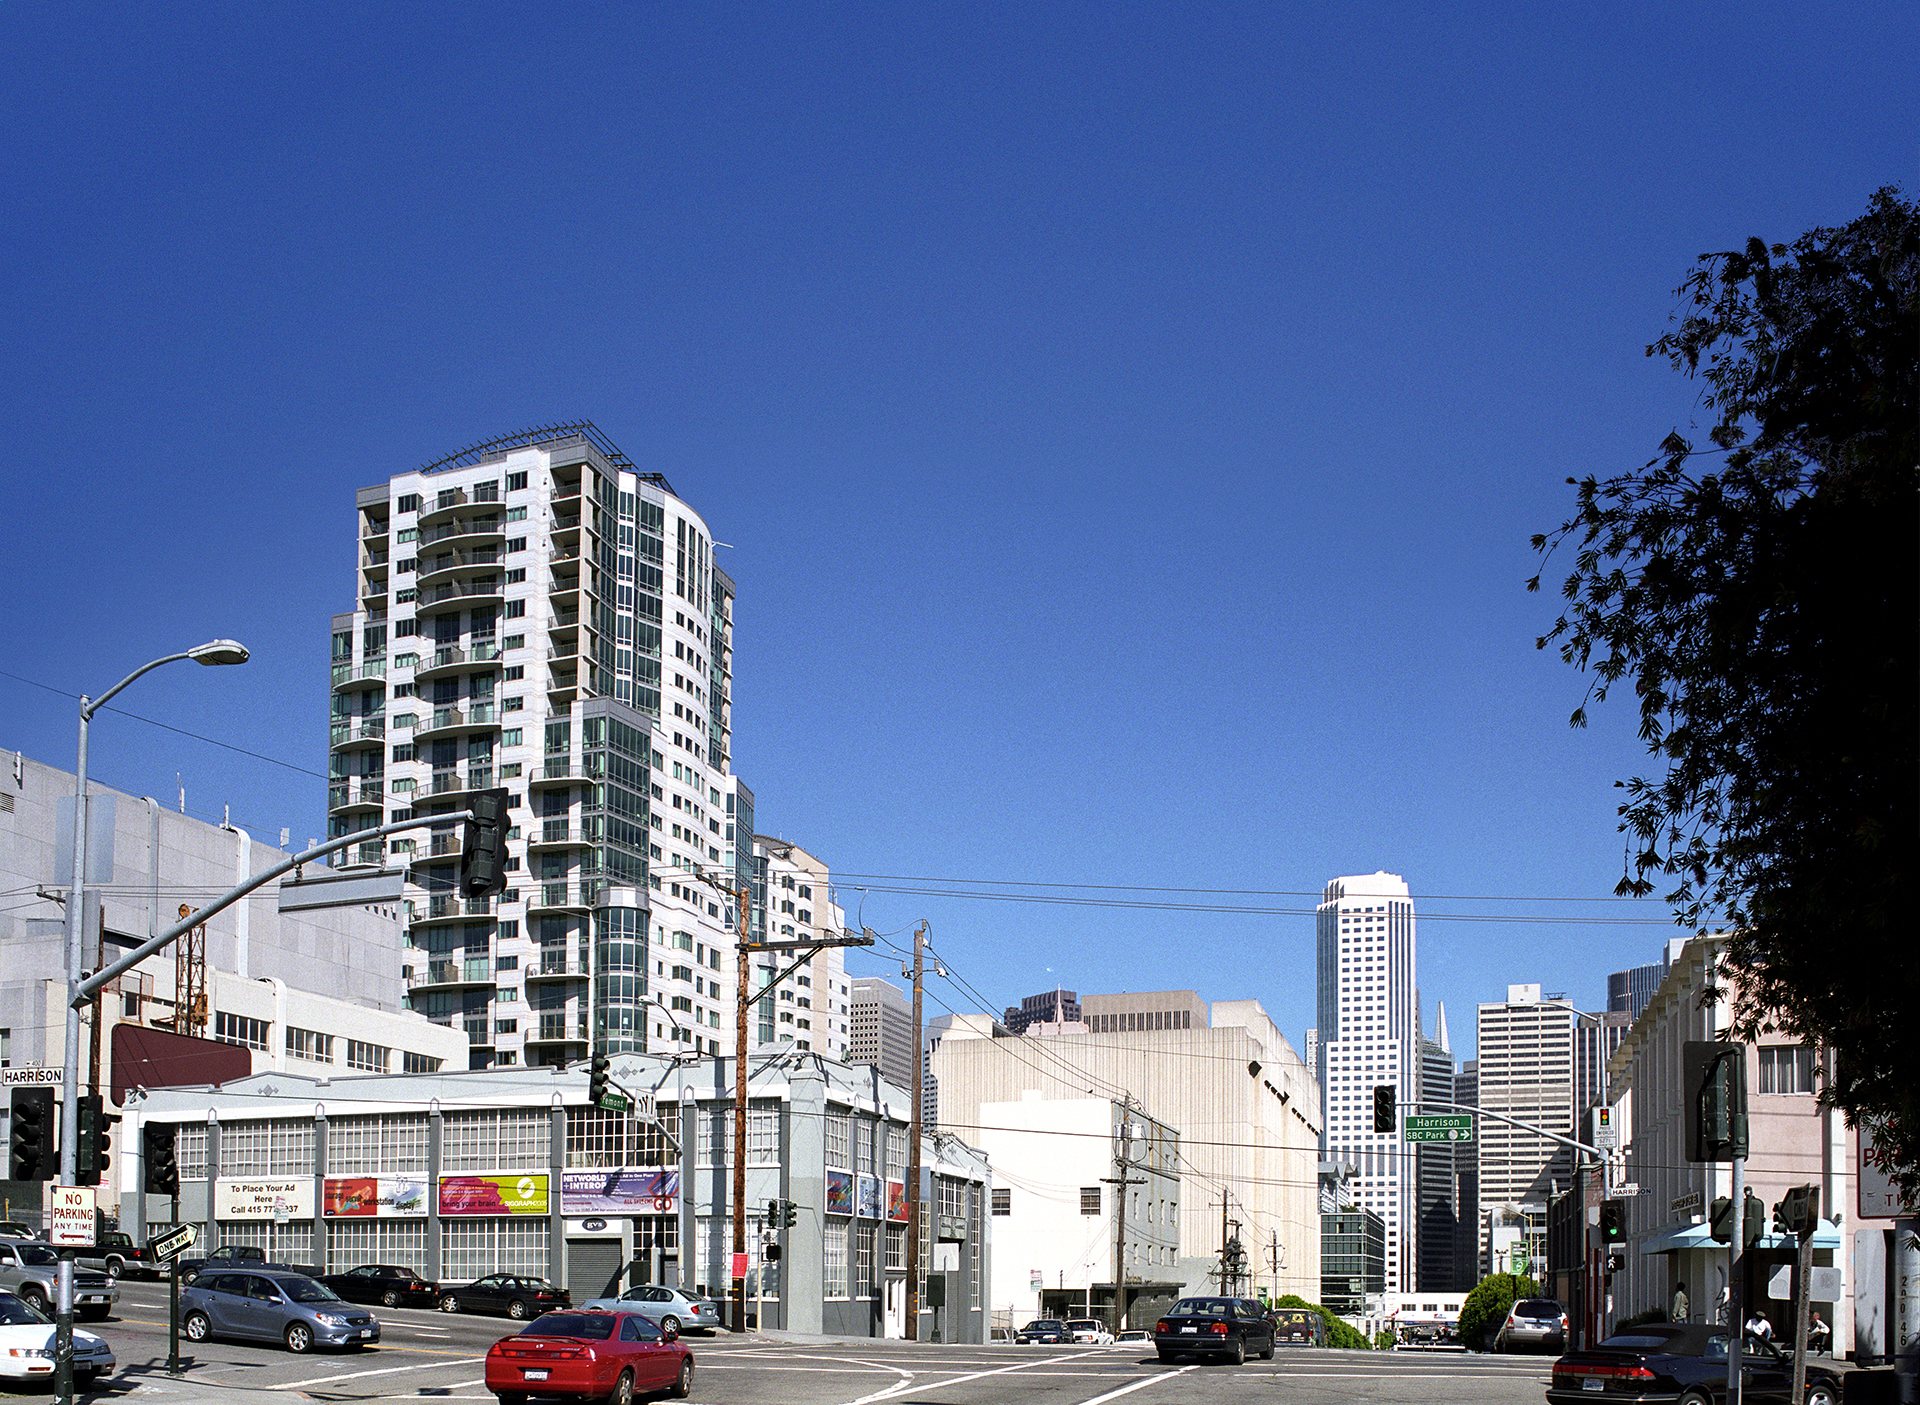
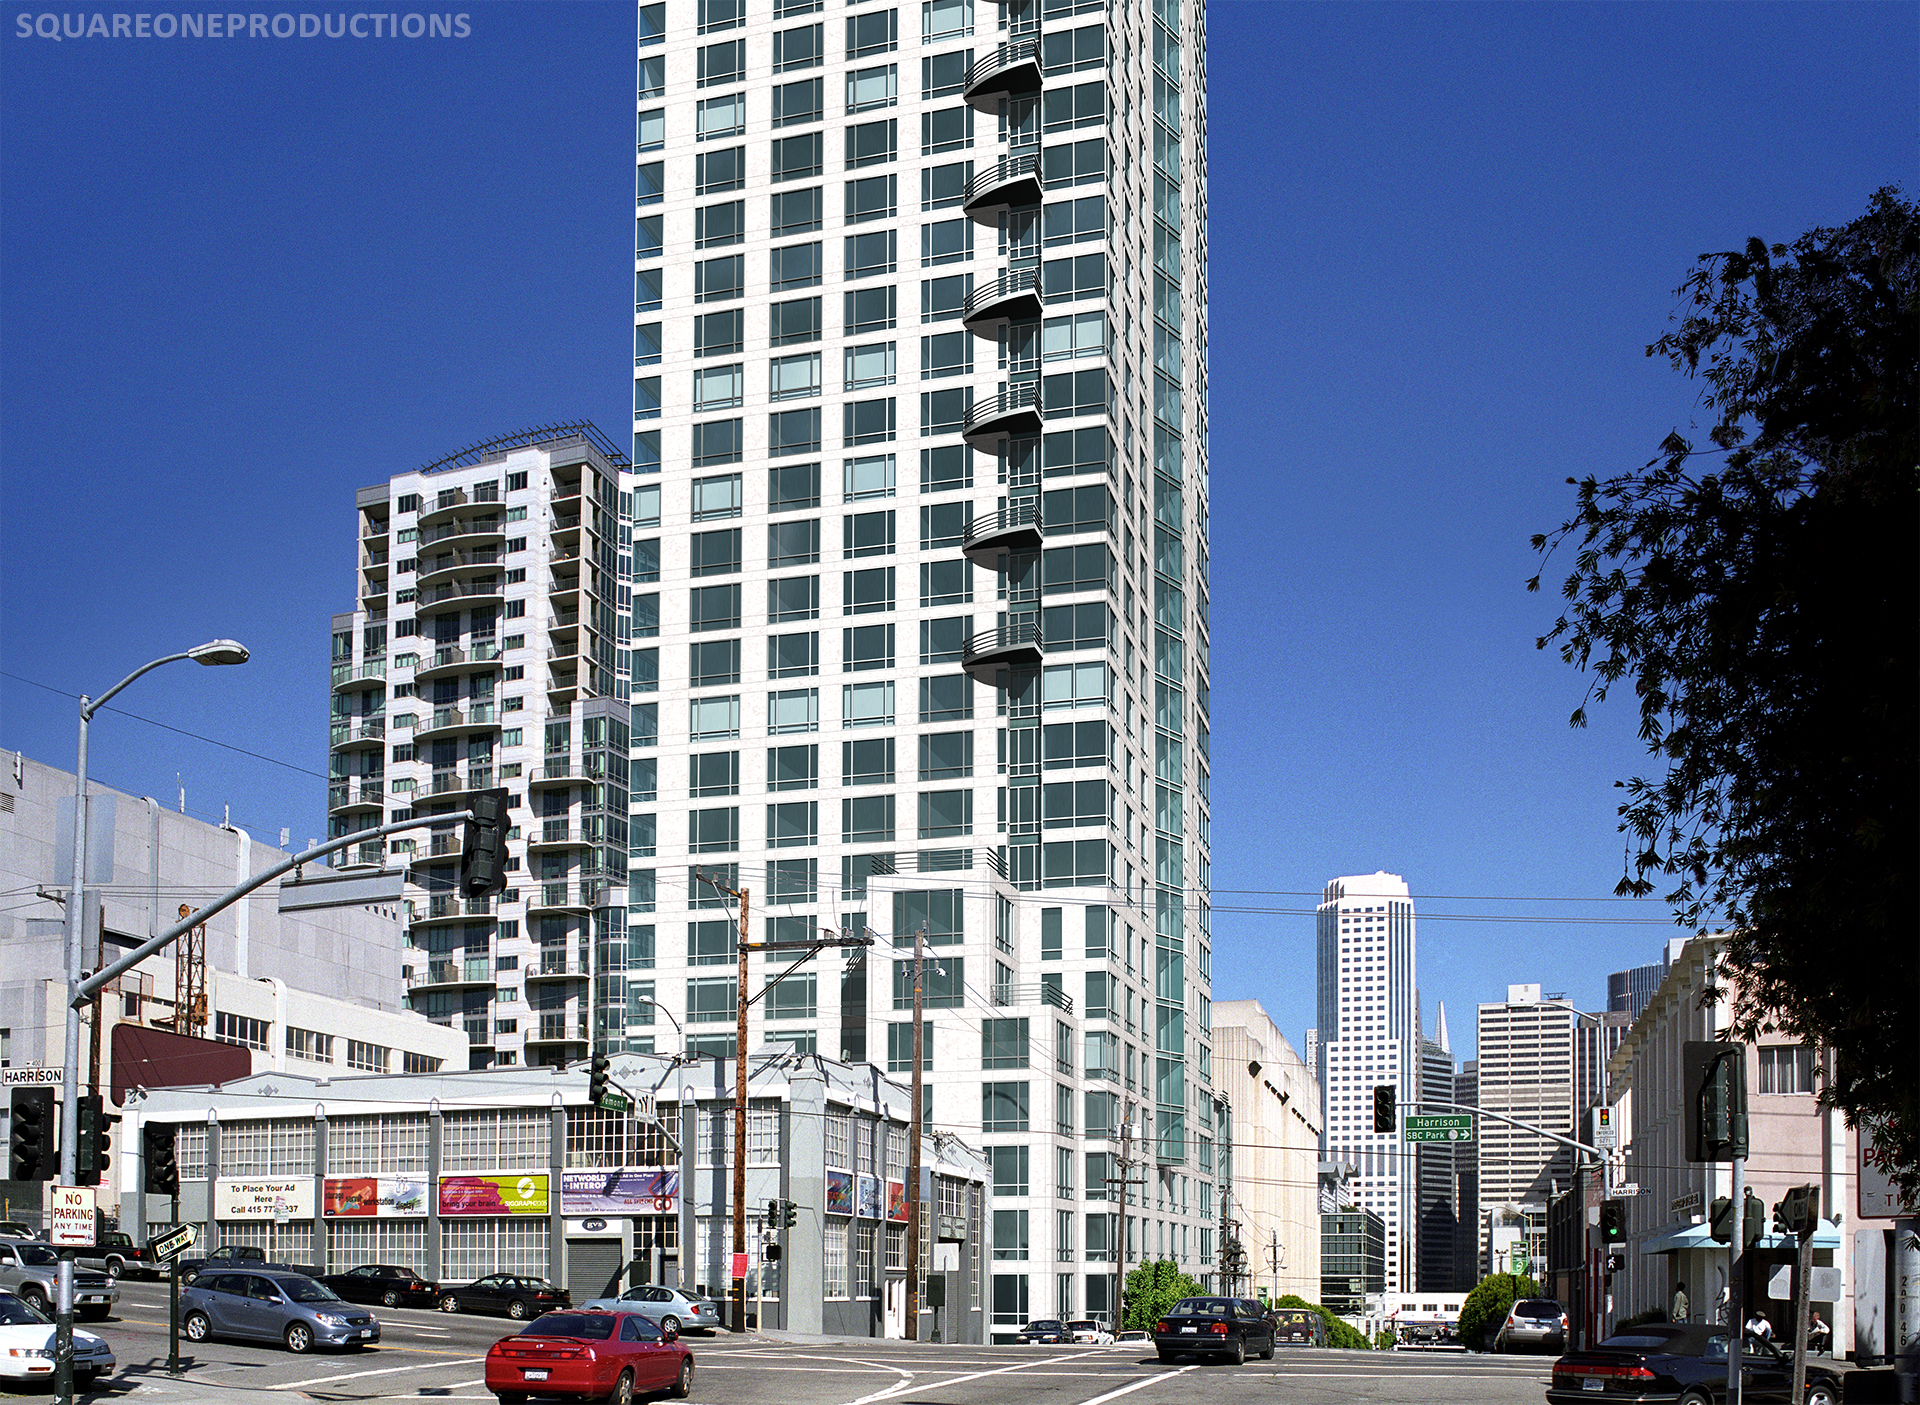
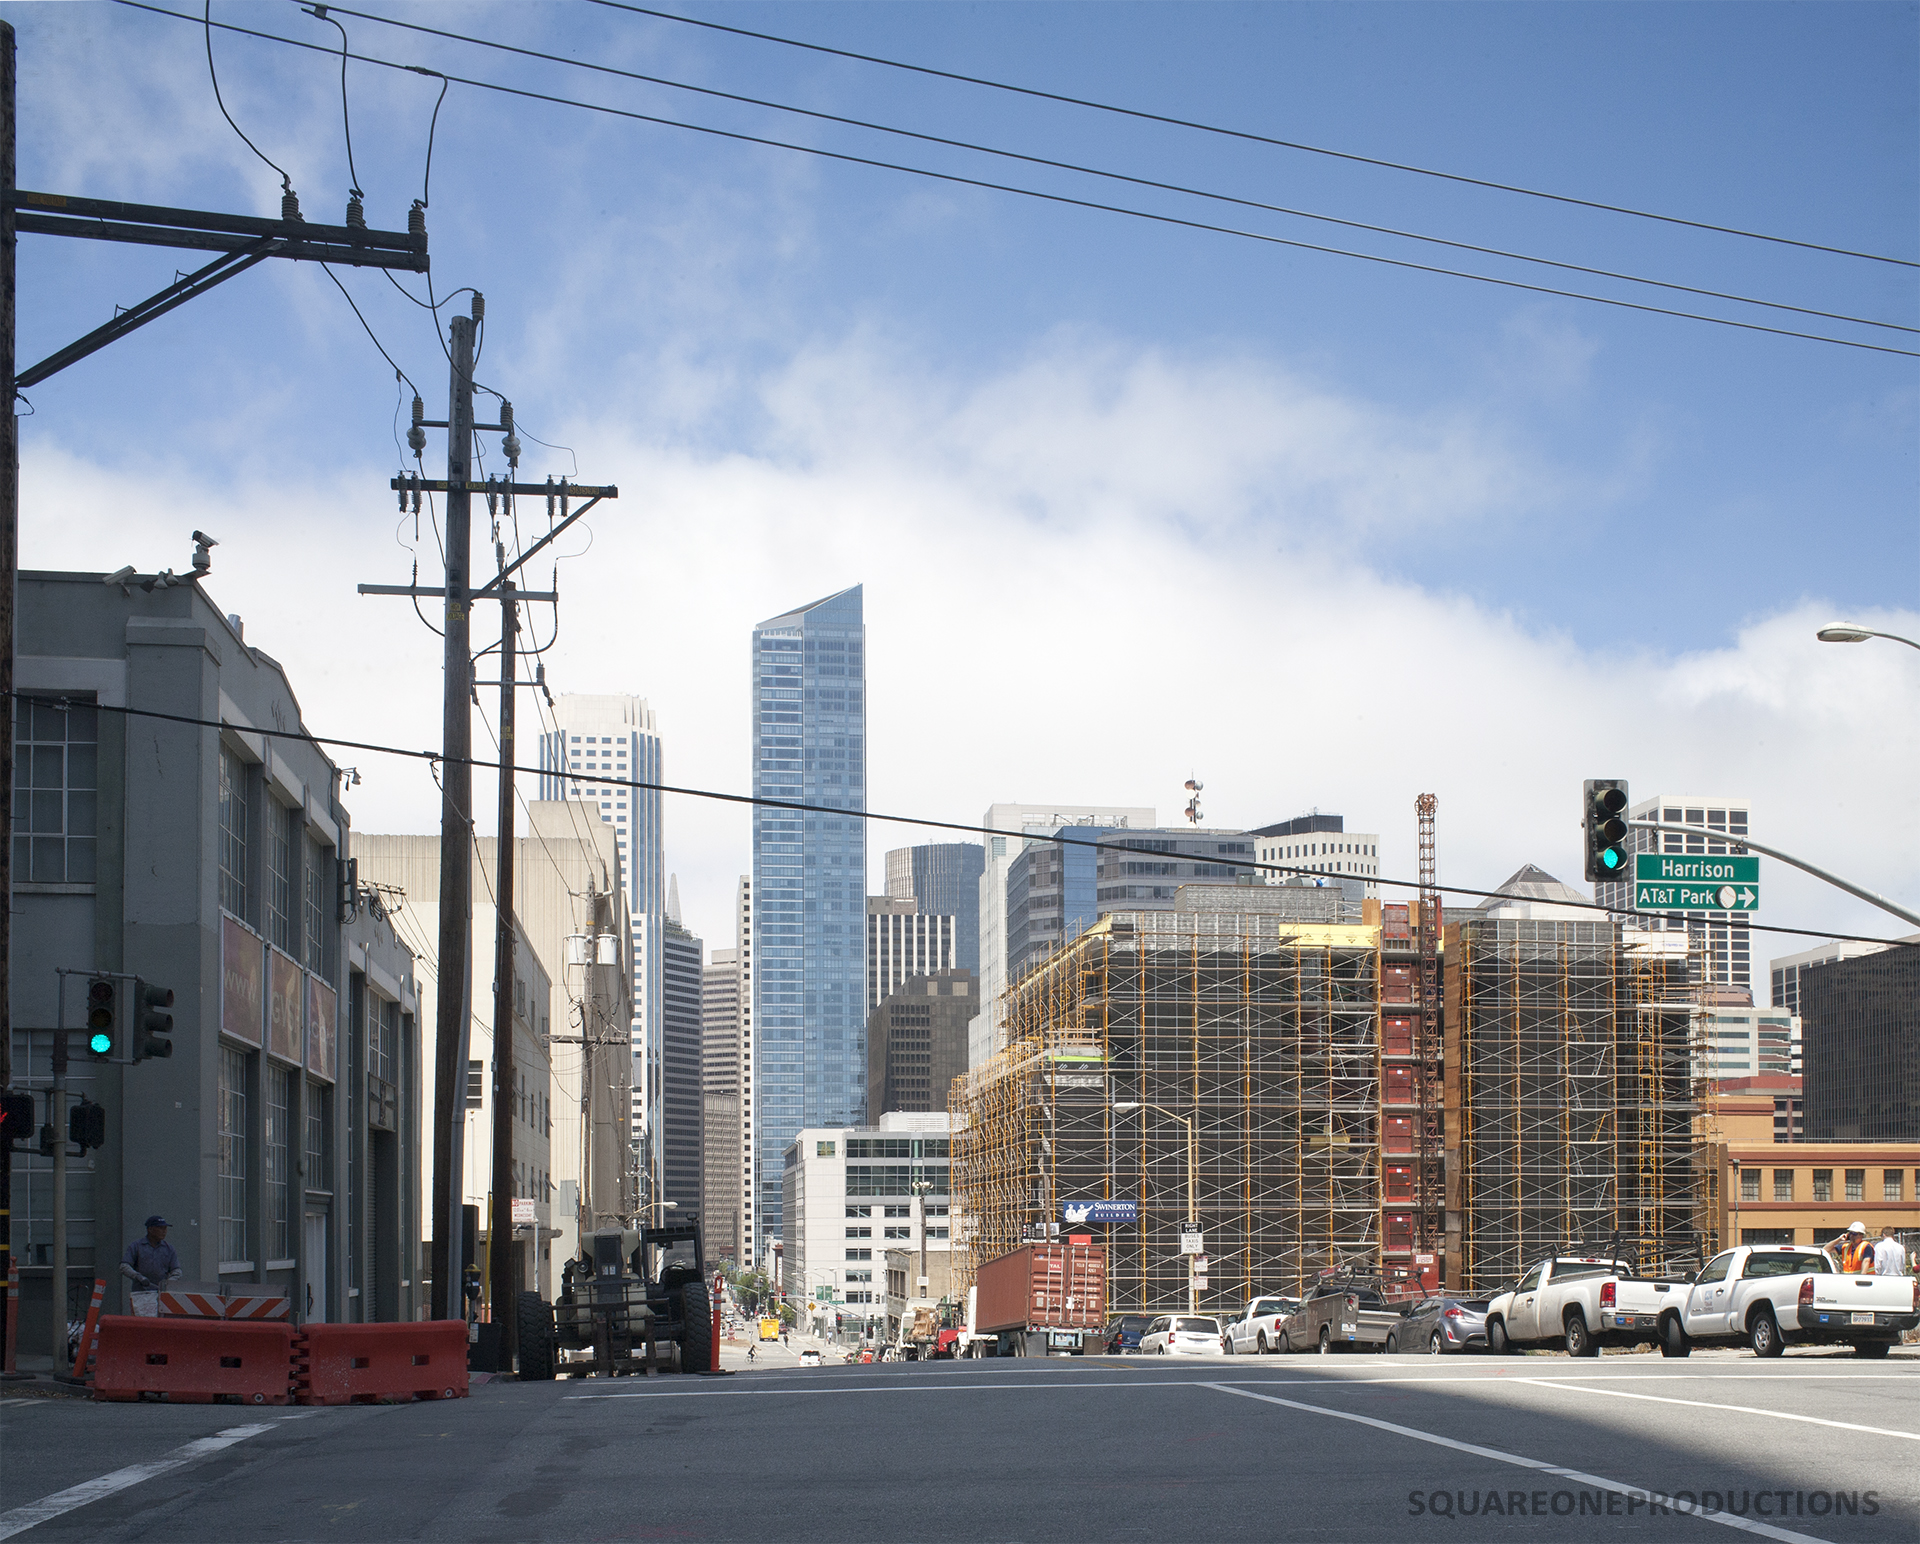
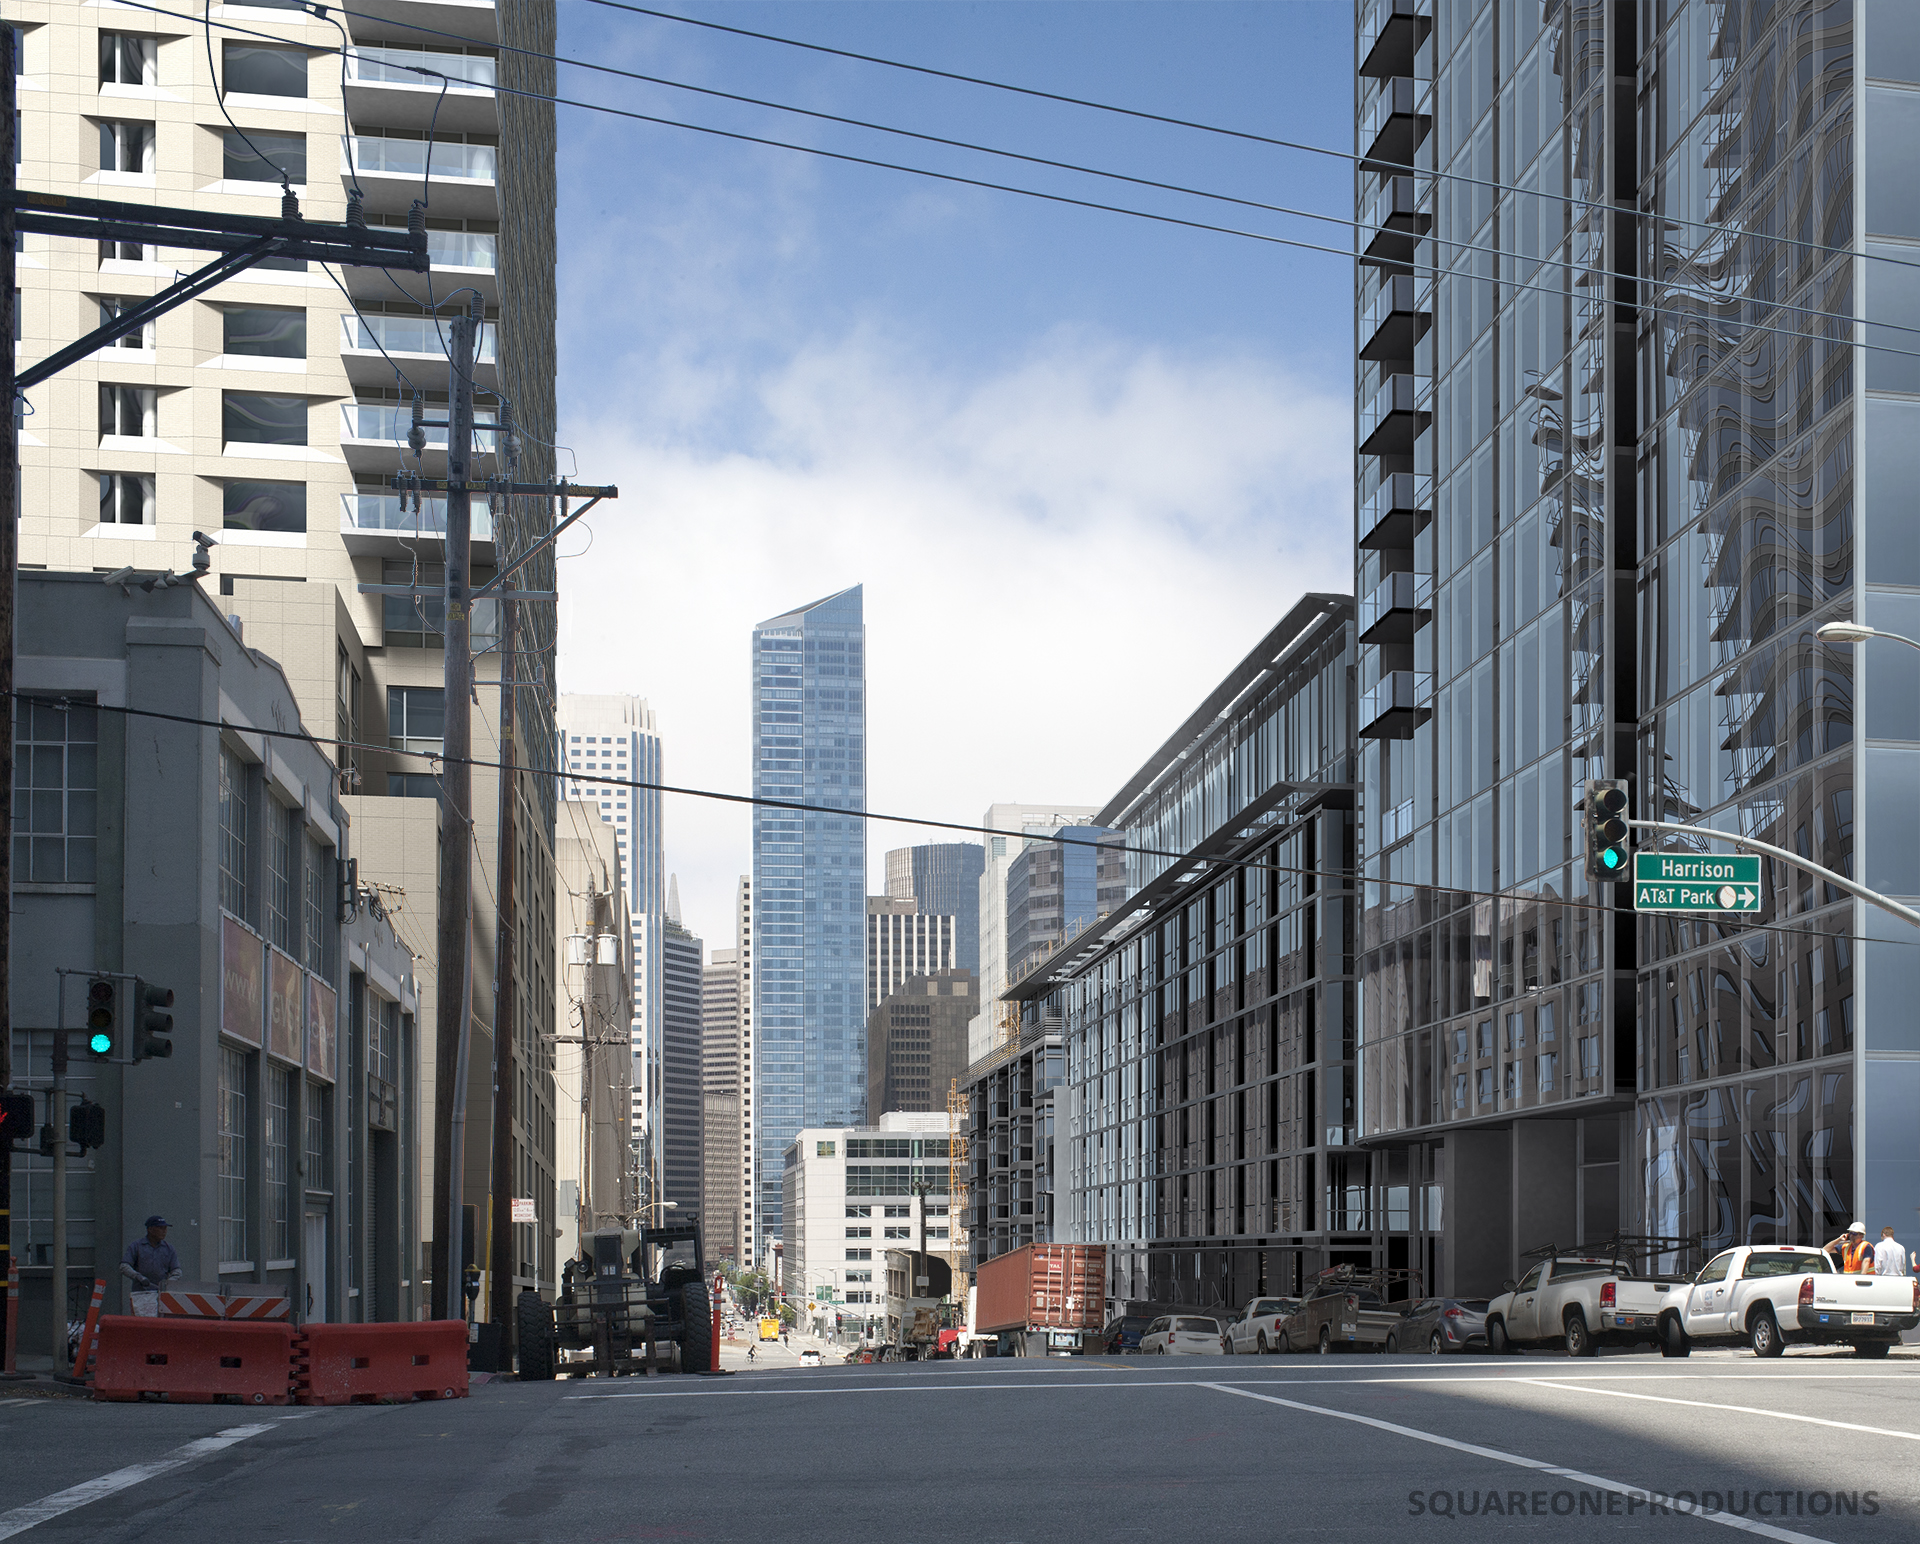
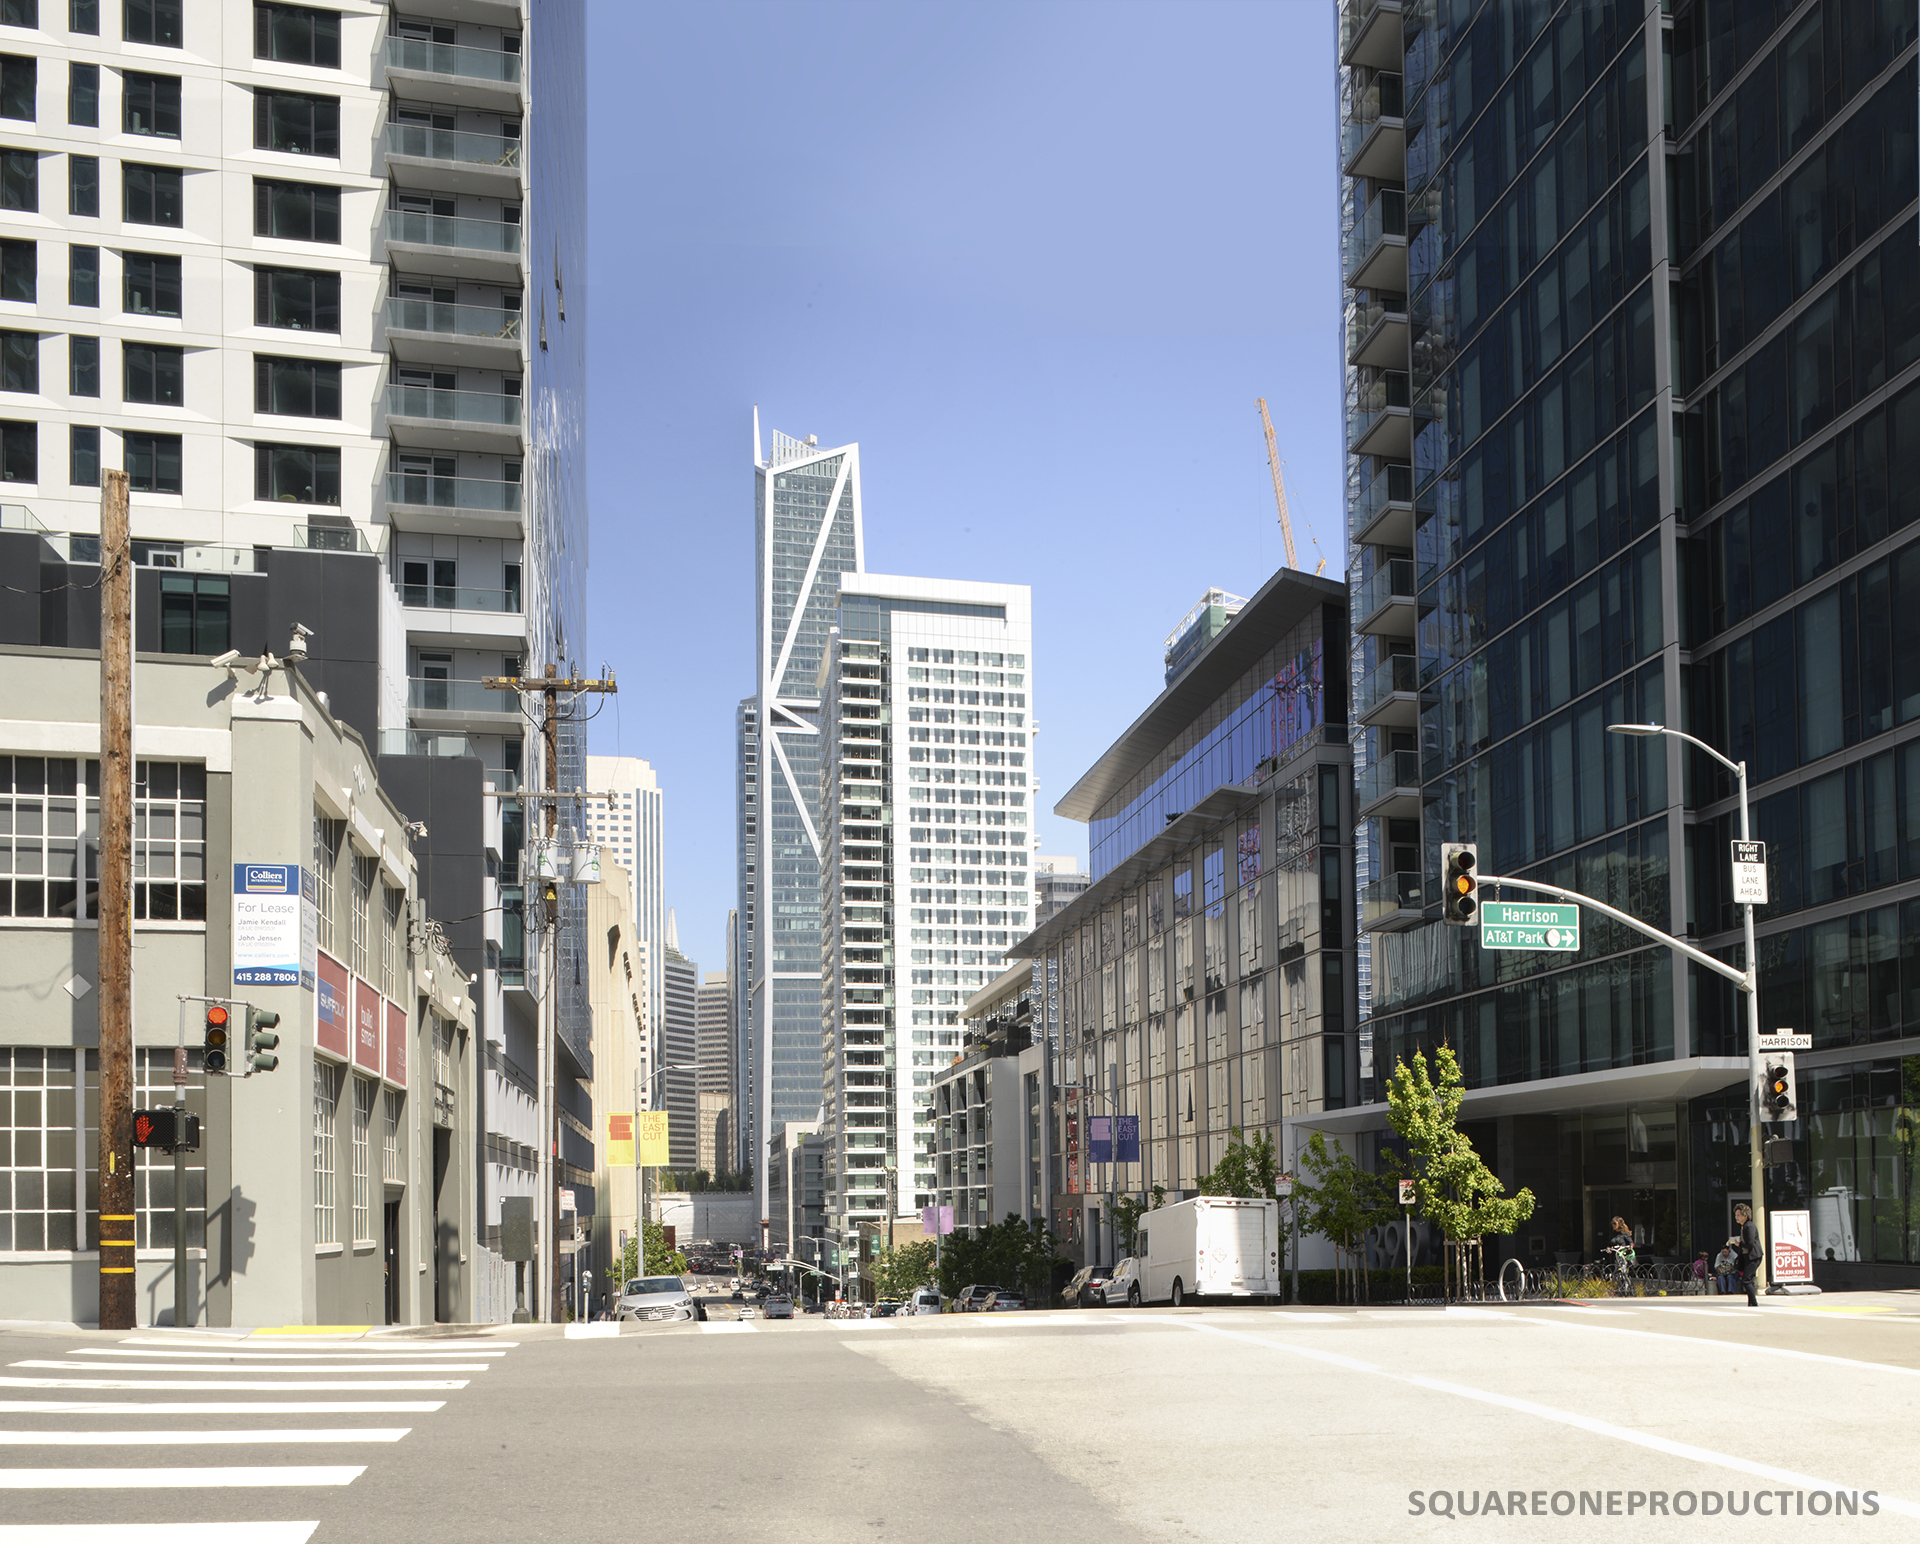
The Rincon Hill Plan drastically transformed the 300 block of Fremont Street. Here is a photo of it in 2005, with the simulation we produced and how it looks today.
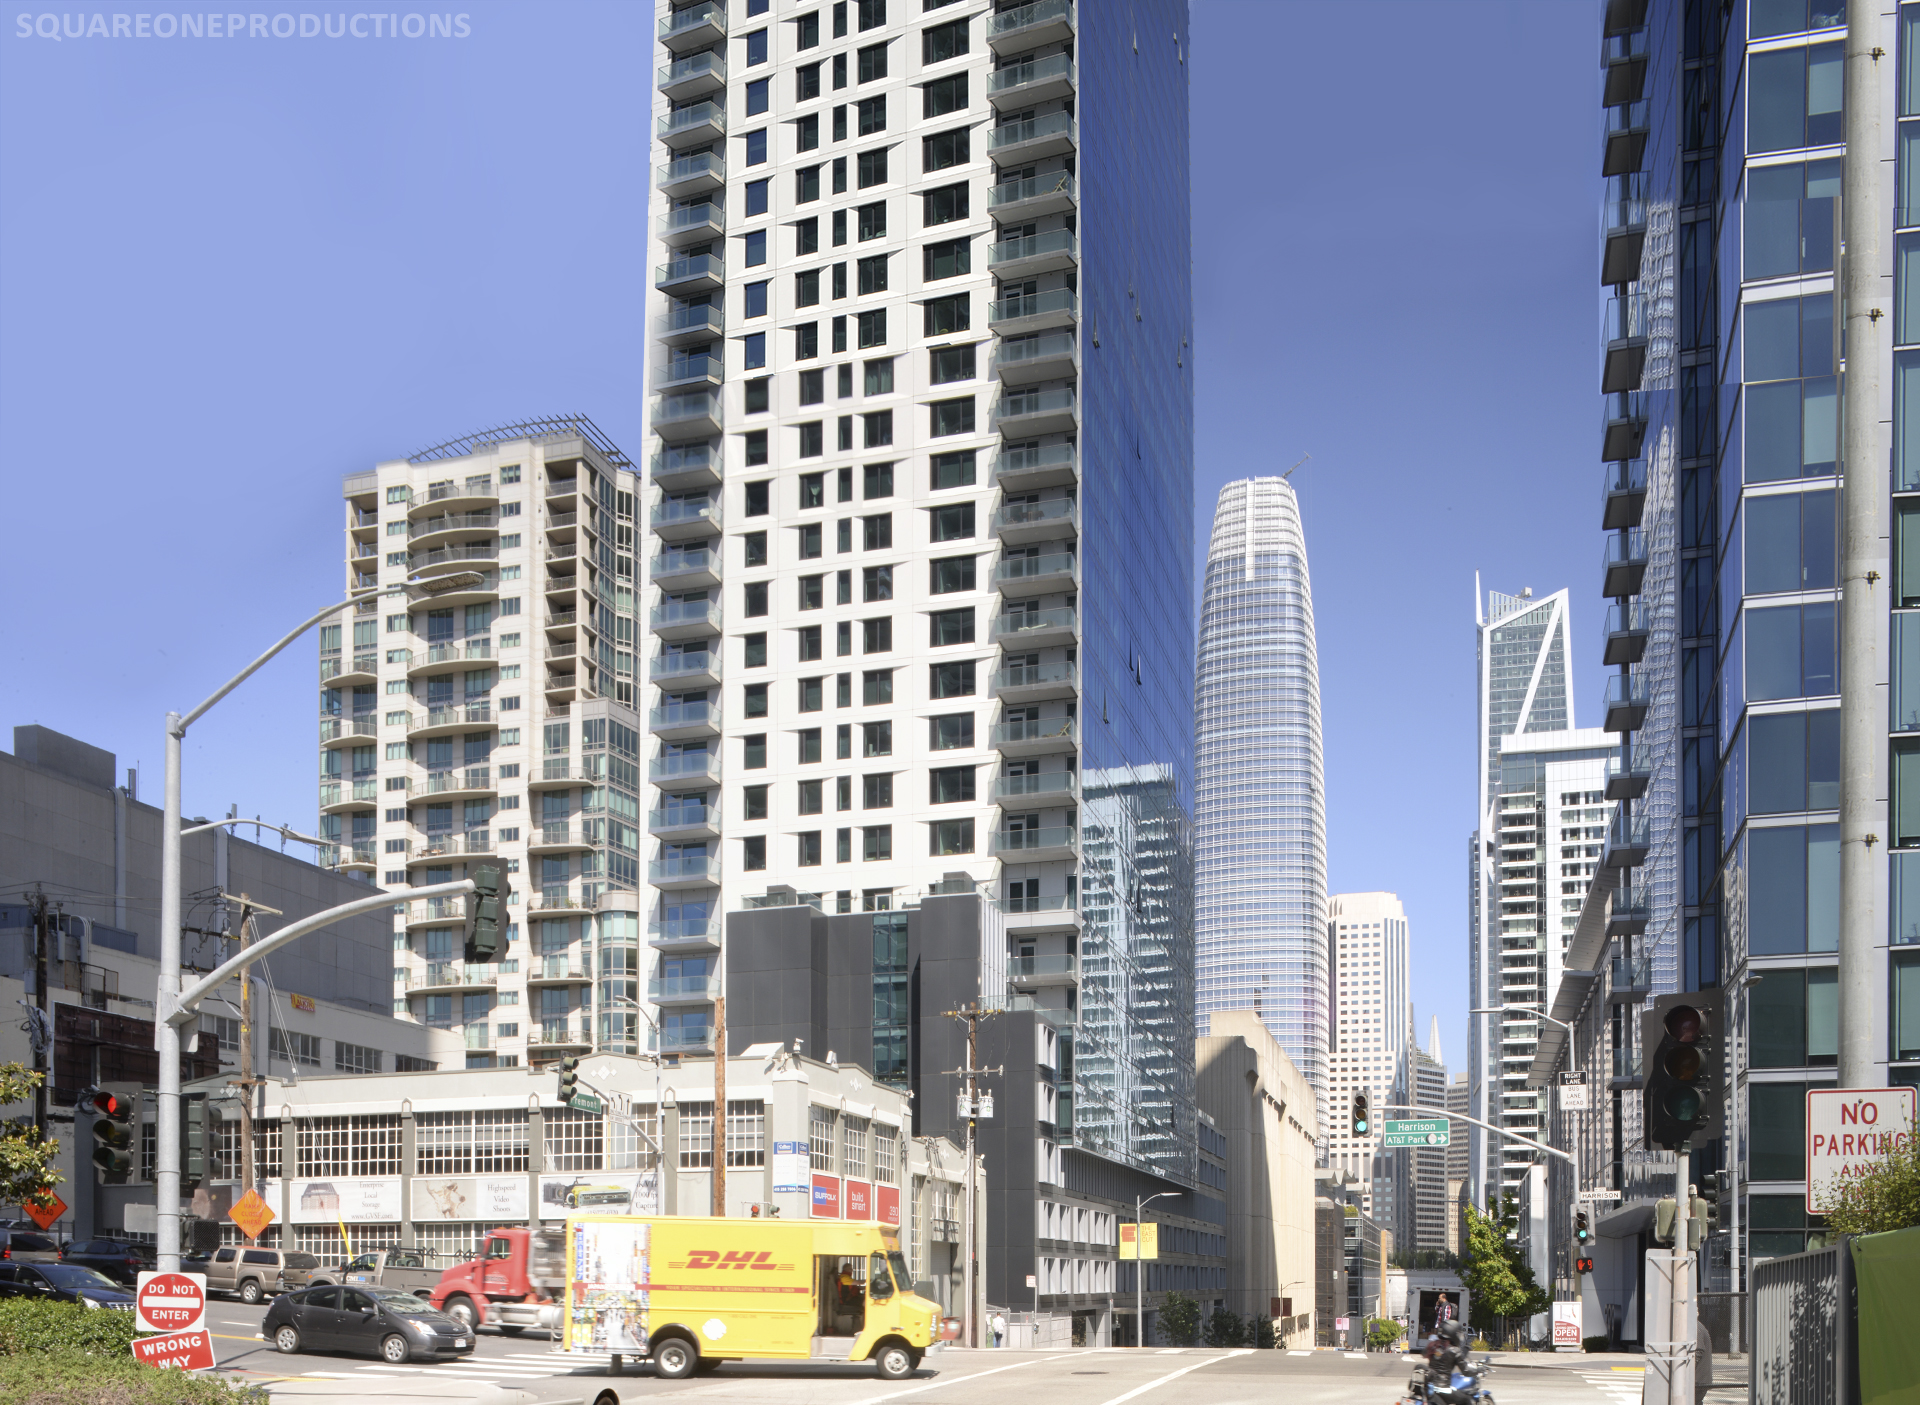
We simulated 325 Fremont from the same intersection, different corner, 8 years later. 399 Fremont, already under construction, was included.
Some of our other Rincon Hill projects throughout the years: